Client & product
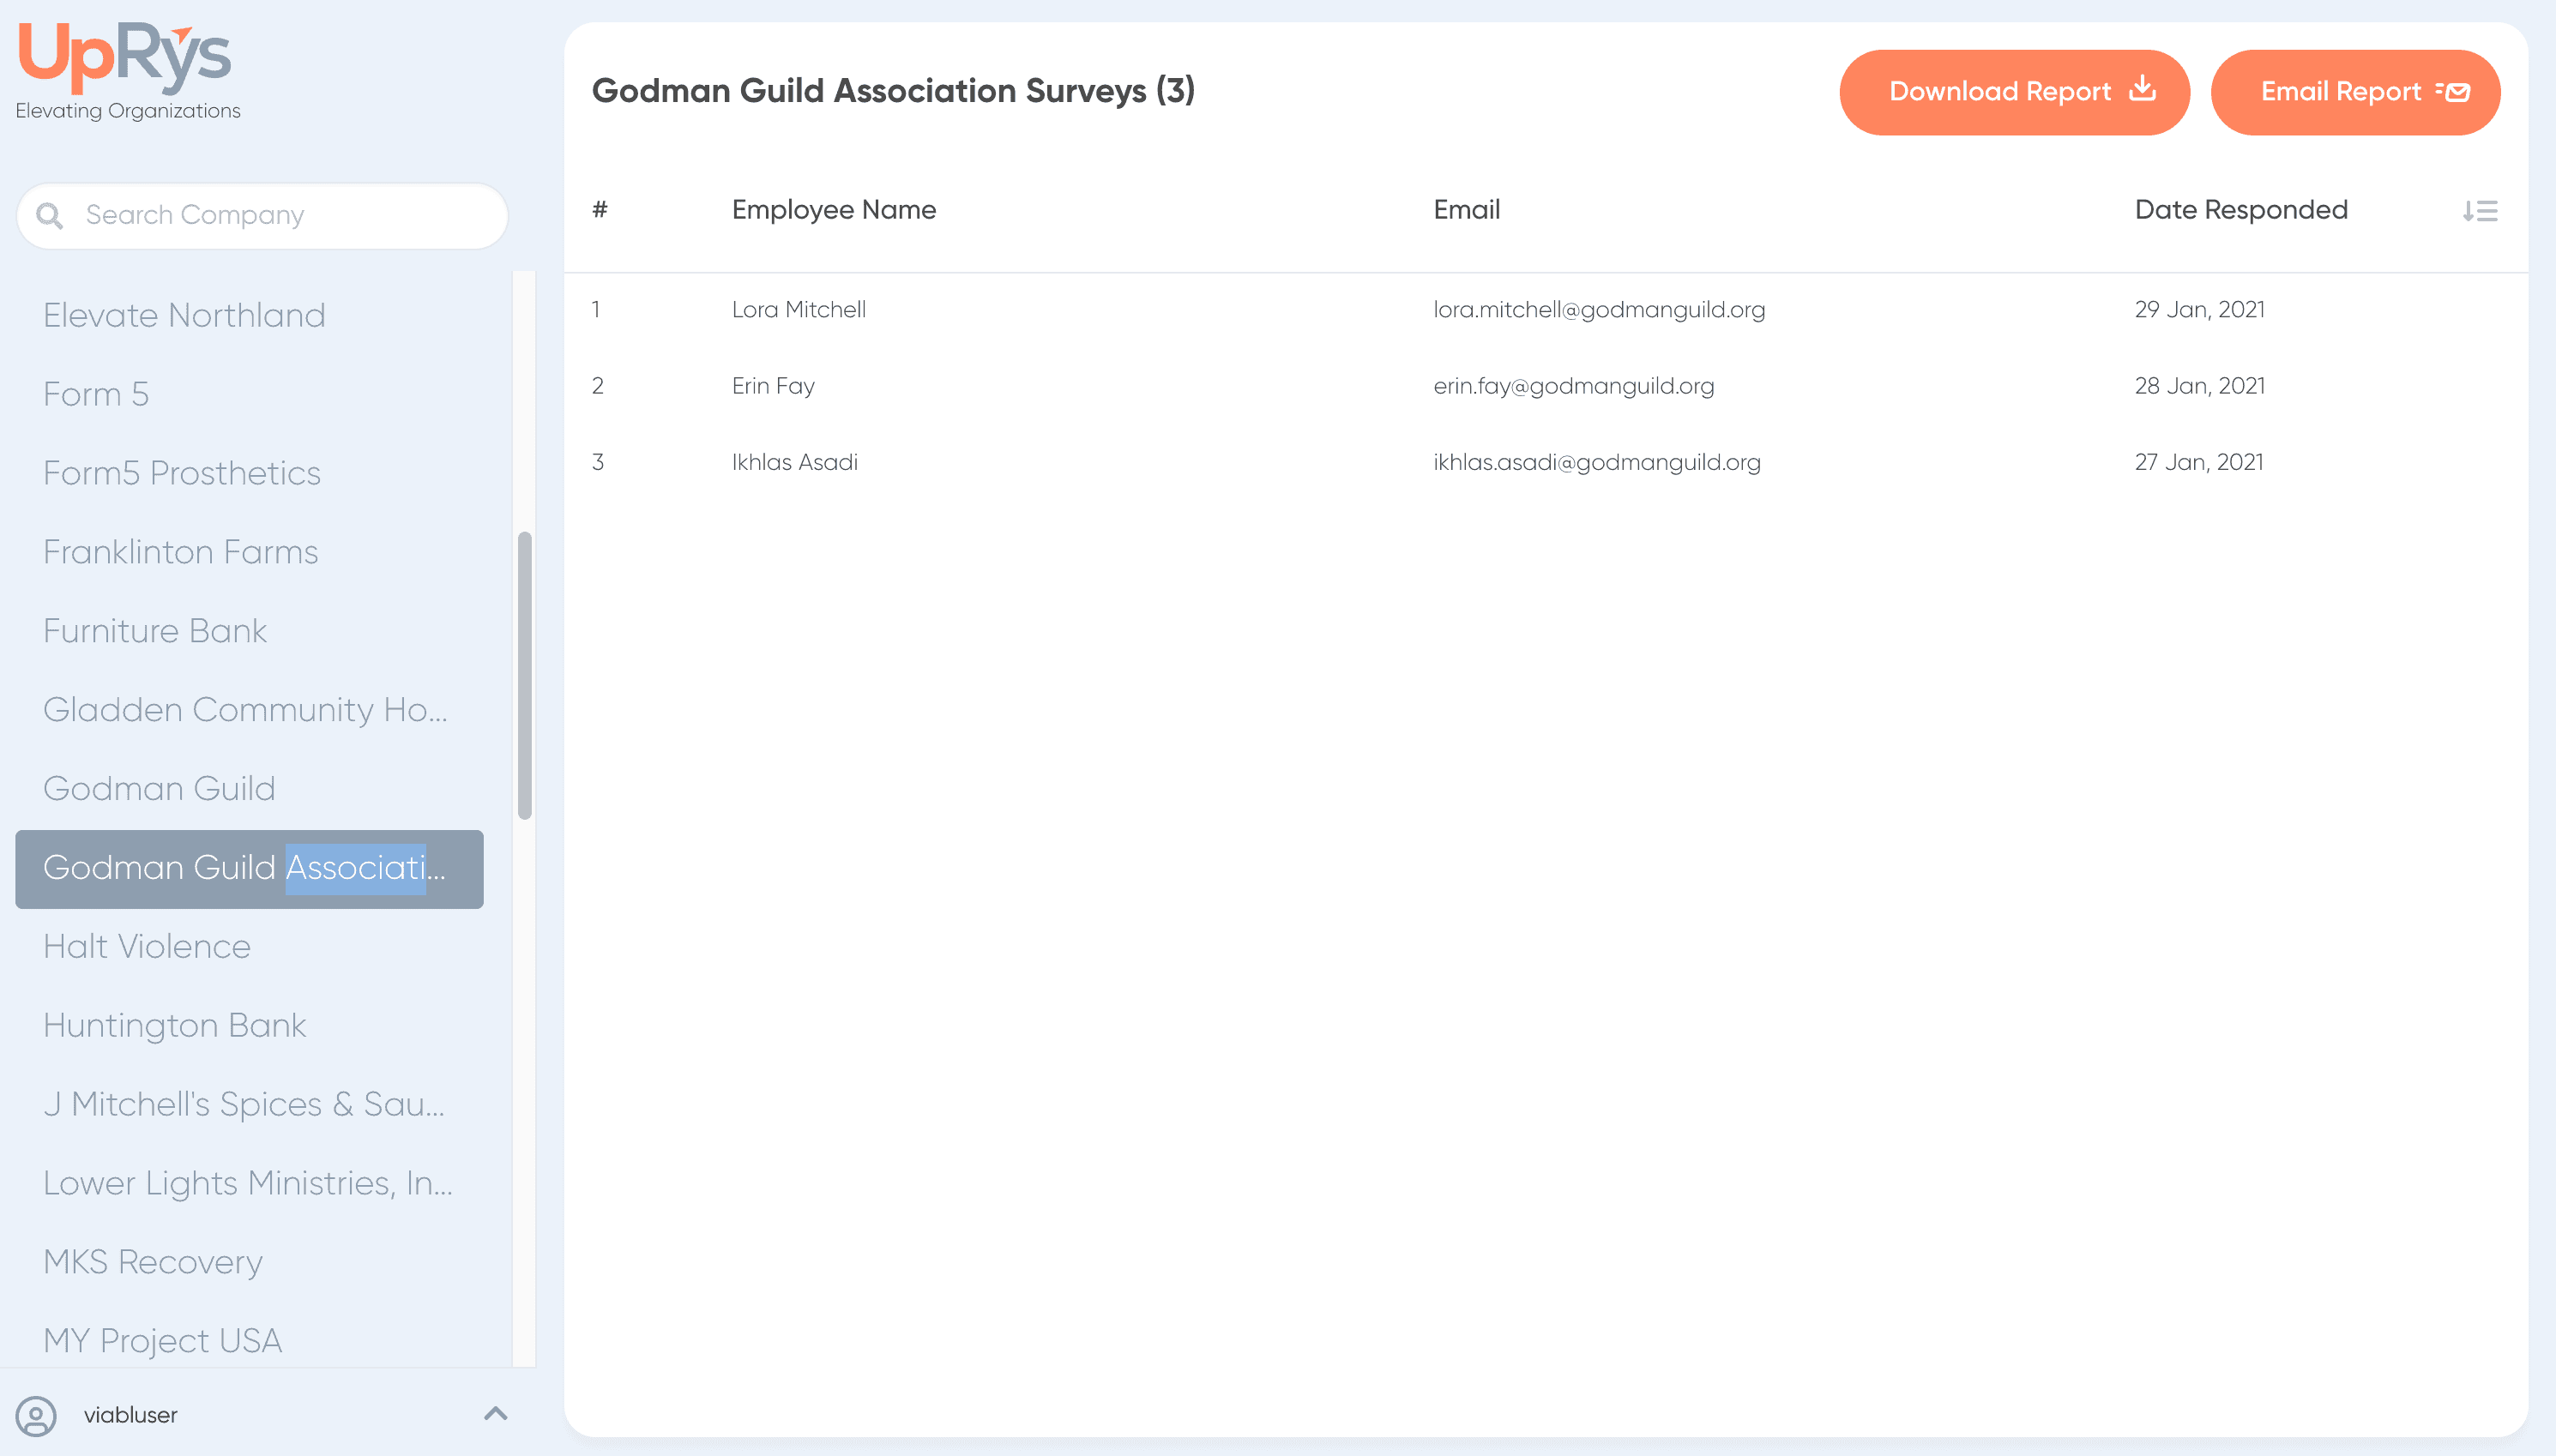
Uprys is an insights and reporting platform designed to help businesses, particularly nonprofits and small enterprises, understand their performance. The platform provides a comprehensive view of business health by analyzing various data points and generating actionable insights. Uprys embodies the core philosophy of Evolve, Optimize, Elevate, guiding organizations towards sustainable success.
Challenges
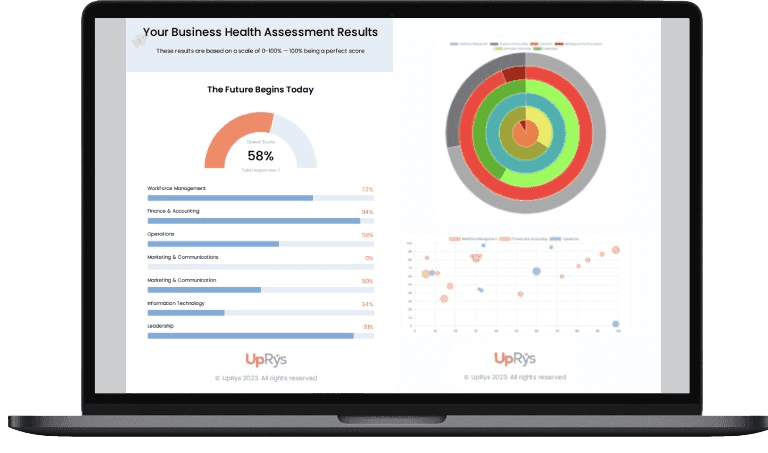
Our client required a solution that not only captured the health of different departments within an organization but also provided valuable insights in a visually engaging manner. Uprys aimed to analyze business processes across several critical domains such as Workforce Management, Finance, Operations, Marketing, IT, and Leadership.
One of the main challenges was to ensure that the survey responses collected from different stakeholders were processed into meaningful insights. Converting subjective responses into quantifiable scores presented a unique challenge. Furthermore, the visual representation of these insights in a PDF format required complex graph and chart generation, which was difficult to achieve with standard PDF libraries.
Solution Approach
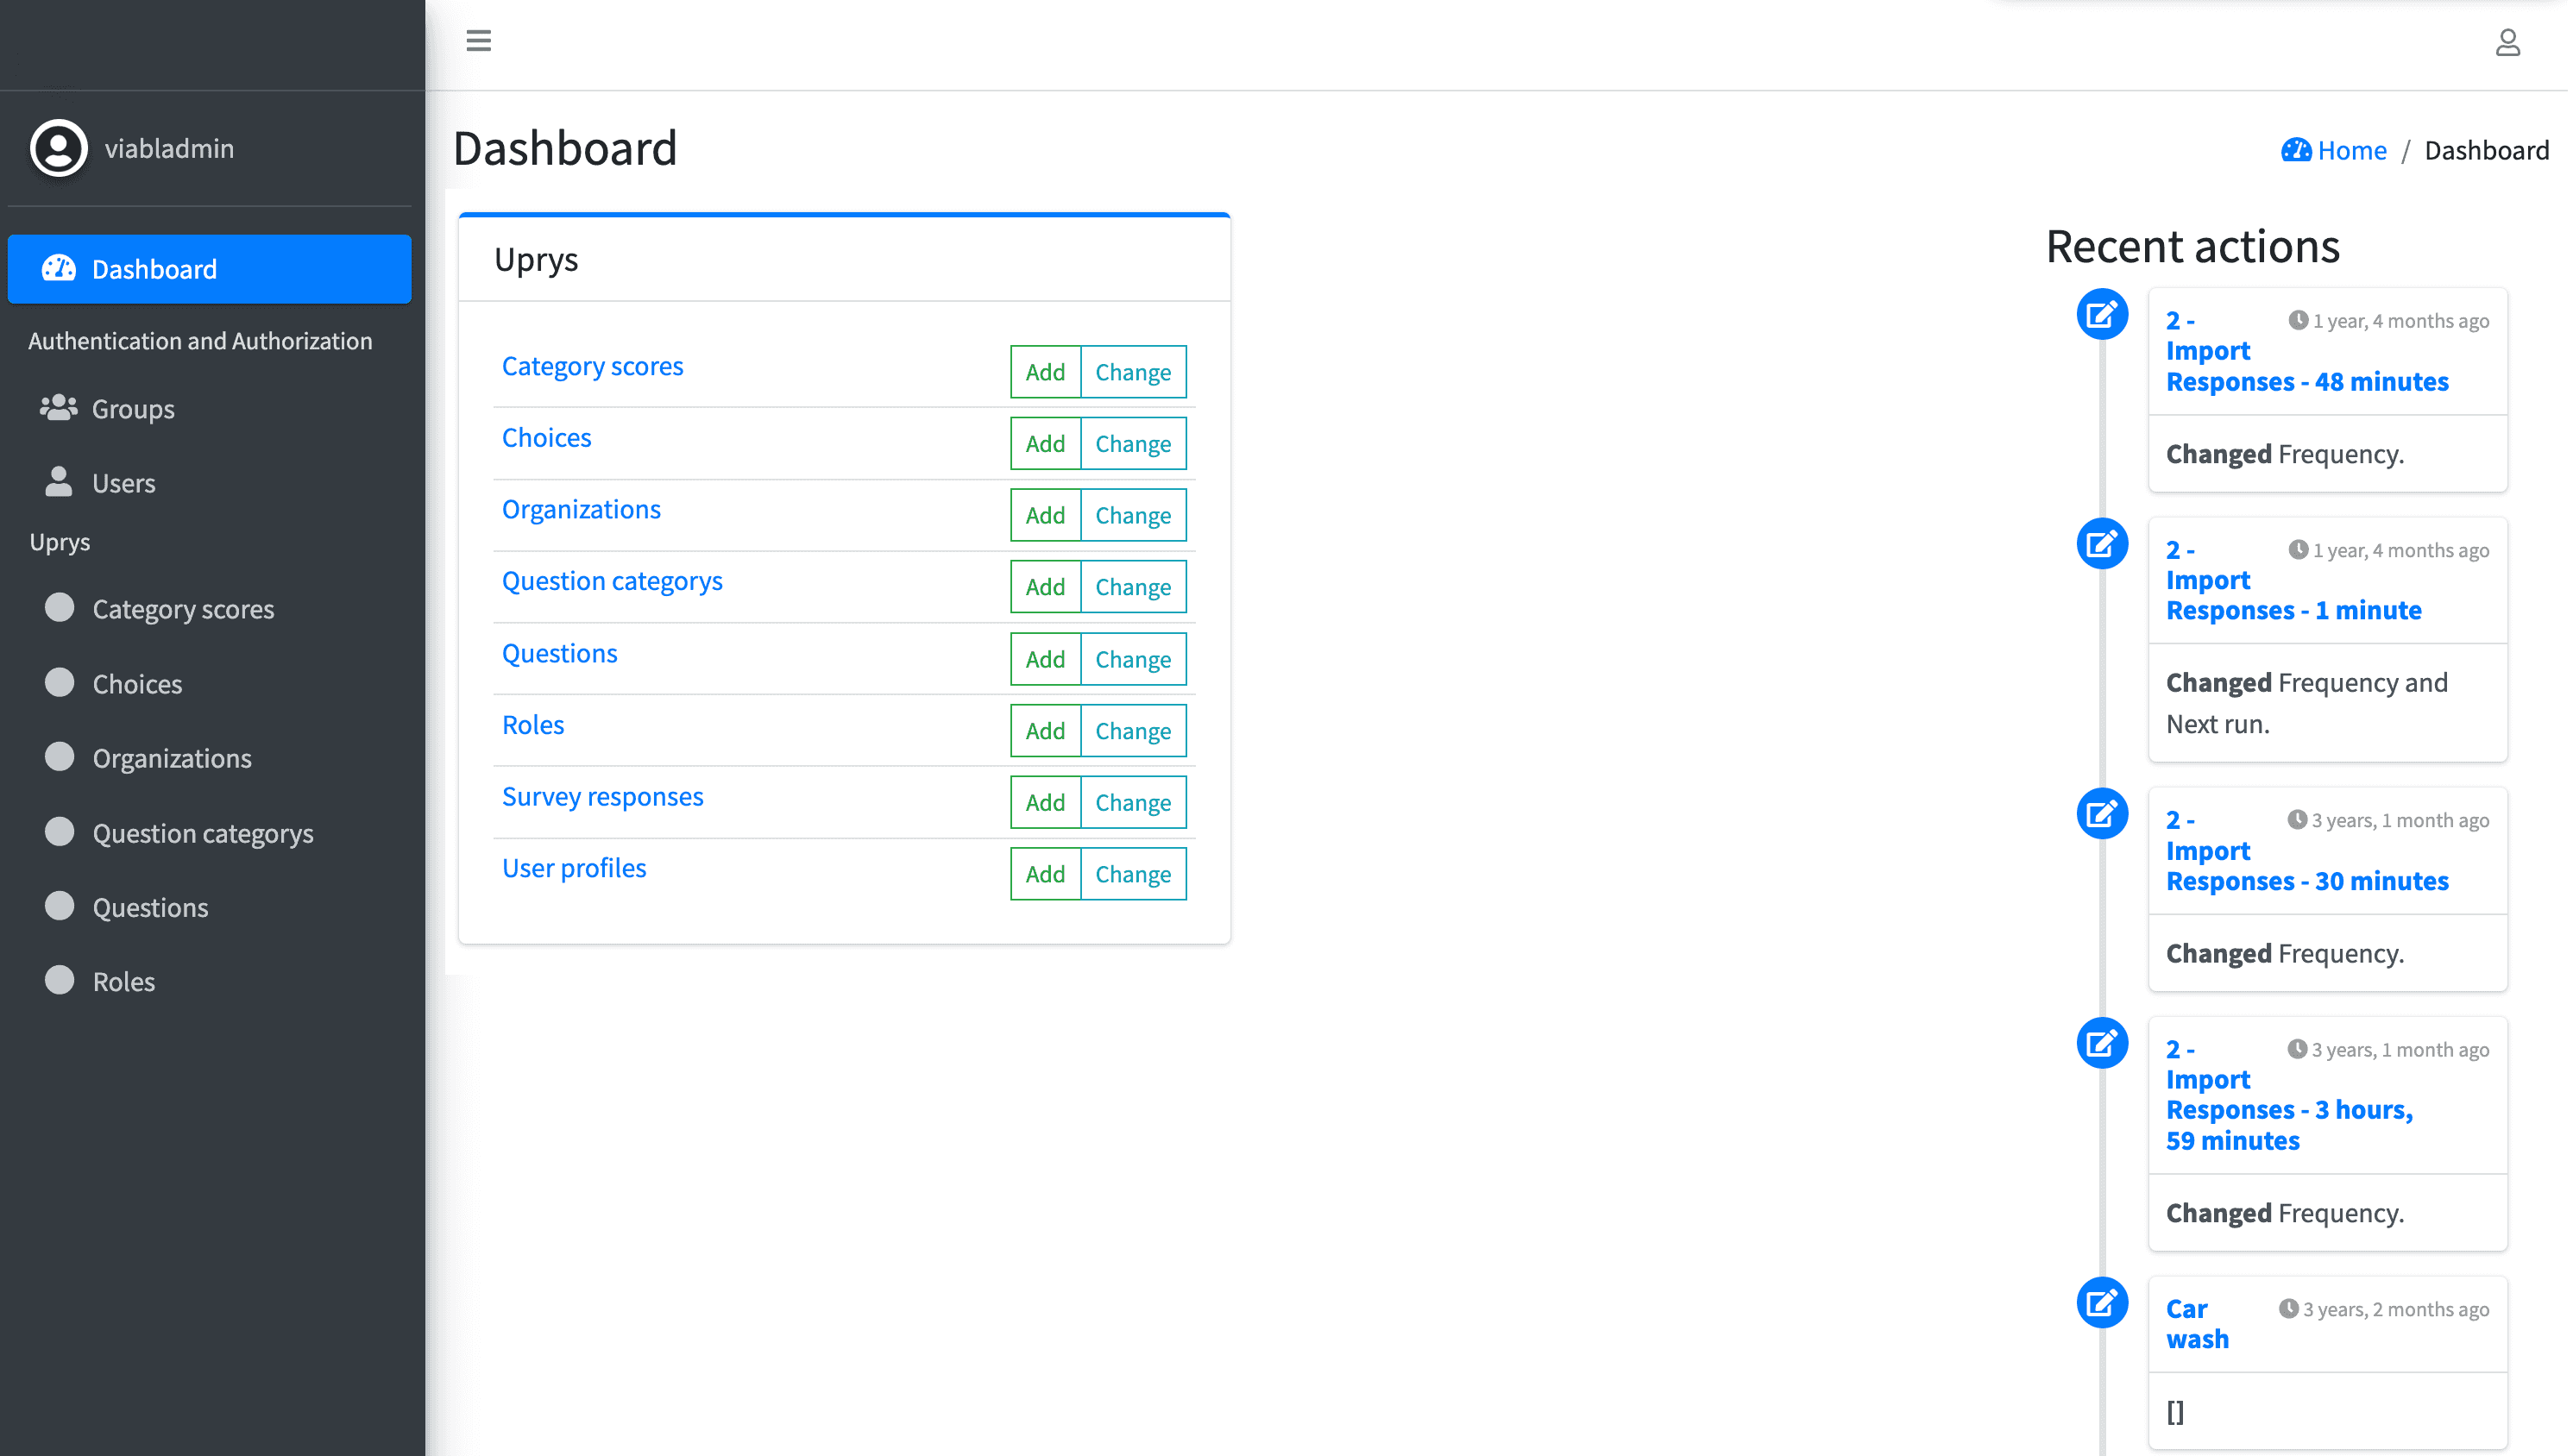
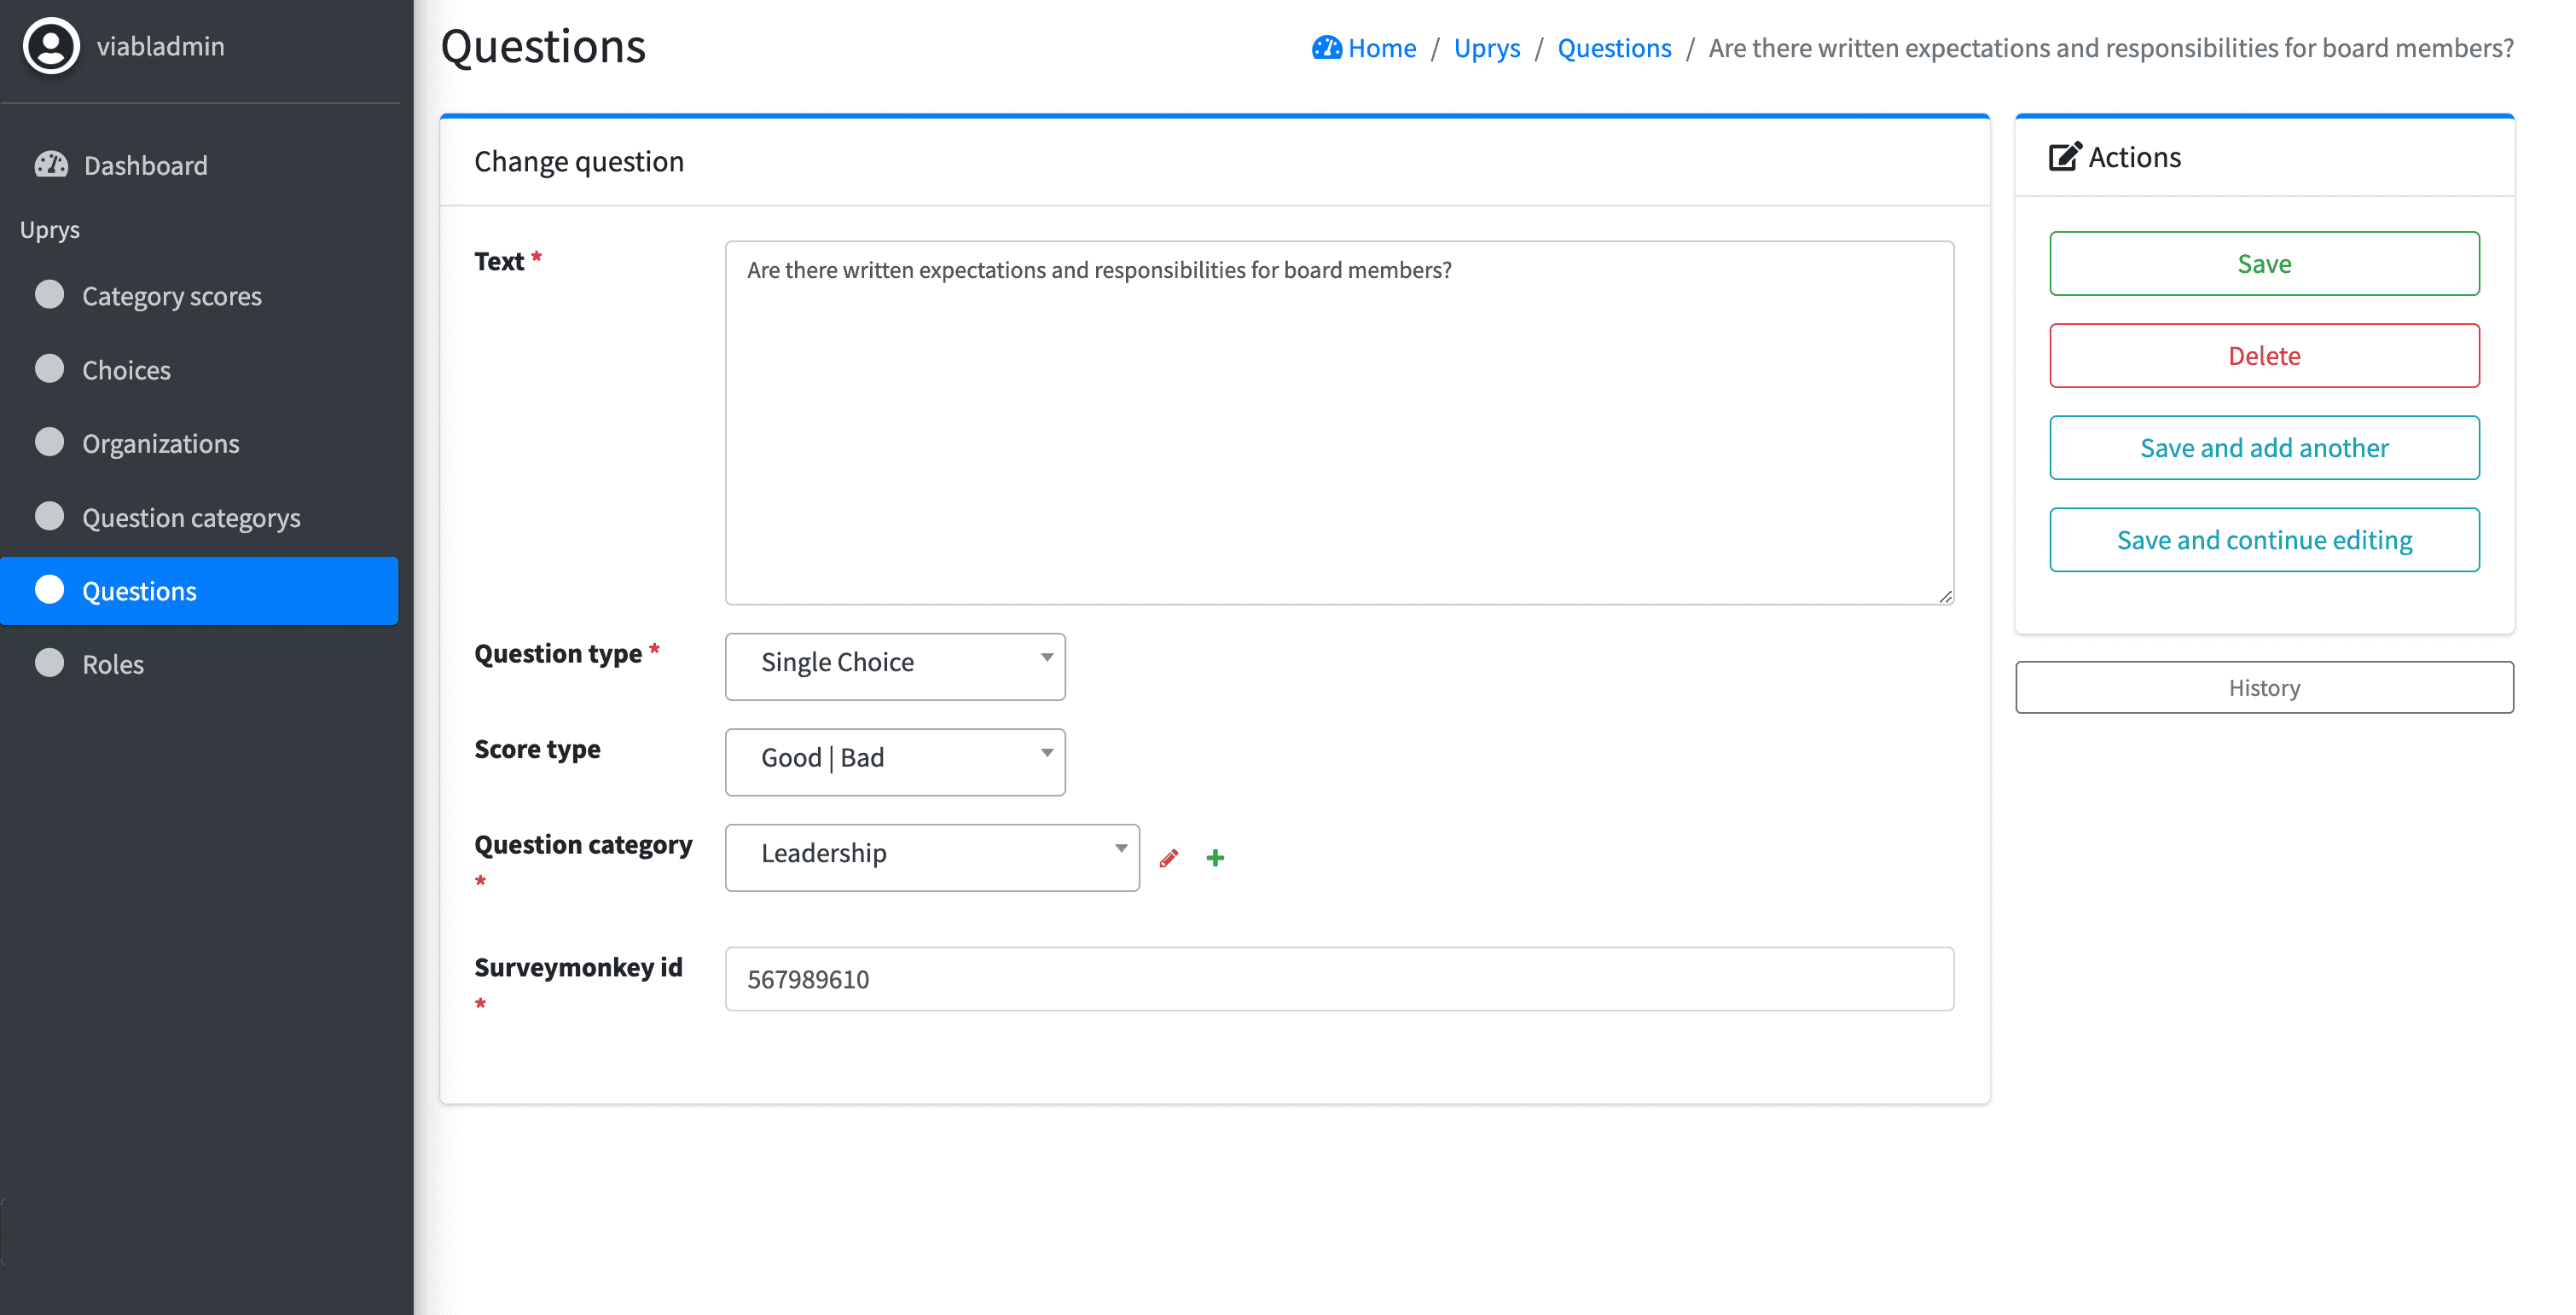
We began by developing an Admin Portal that allowed Uprys admins to create custom surveys tailored to the needs of different organizations. Admins could choose from various question types, including multiple-choice and free-text questions, organized under different categories.
For the scoring mechanism, we devised an innovative algorithm that converted survey responses into percentage-based scores. This algorithm considered multiple factors, ensuring that the insights provided were both accurate and relevant to the organization's needs.
To address the challenge of creating visually rich PDF reports, we developed a custom PDF generation service. By utilizing a headless browser, we were able to render complex visualizations, including advanced charts and graphs such as fuel gauges. This service was seamlessly integrated with the Django backend, ensuring that the reports could be generated and delivered to users on the fly through the SendGrid API.
Technology Stack
Given the time constraints, we opted for the Python and Django framework. Django's built-in admin dashboard was instrumental in speeding up the development process, allowing us to deliver a functional product within weeks. The framework's flexibility and robustness allowed us to build a scalable solution that met all the client's needs.
Key Takeaways
-
Custom Survey Creation: Tailored surveys help organizations gather relevant data from stakeholders.
-
Innovative Scoring Algorithm: A unique algorithm translates responses into actionable insights, guiding businesses toward improvement.
-
Advanced PDF Reports: The use of a headless browser enabled complex visualizations, providing clear and engaging insights.

